Read temperature and humidity data
In Graystack:One, you can monitor the temperature and humidity data of your storage areas to ensure that your goods are stored under optimal conditions. This guide shows you how to retrieve and view temperature data in the application.
What you will learn
Navigating to the storage area in Graystack:One
Viewing the temperature data for a specific storage area
Interpreting the temperature graphs
Navigating to the storage area
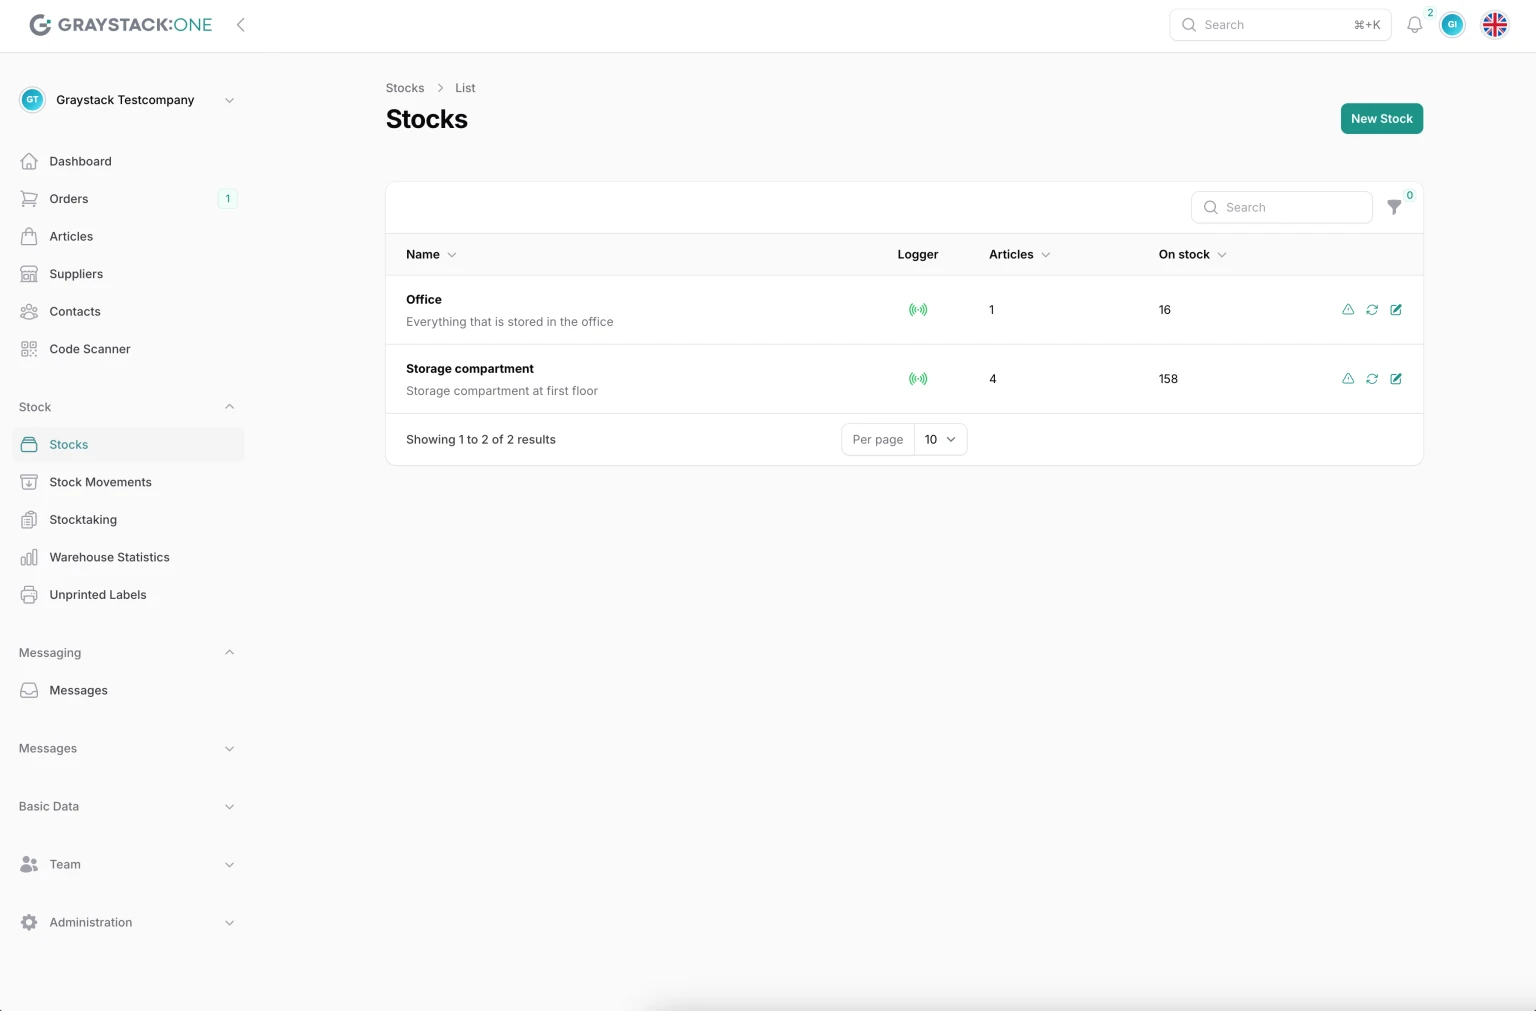
Open the Graystack:One application and log in. Go to the "Stock" section in the left navigation bar and select "Stocks." This will open an overview of all storage areas.
Viewing the temperature data for a storage area
In the list of storage areas, you will see a column with a logger icon. This indicates that the corresponding storage area is configured with a logger. Click on the row of the storage area you want to view.
Interpreting temperature graphs
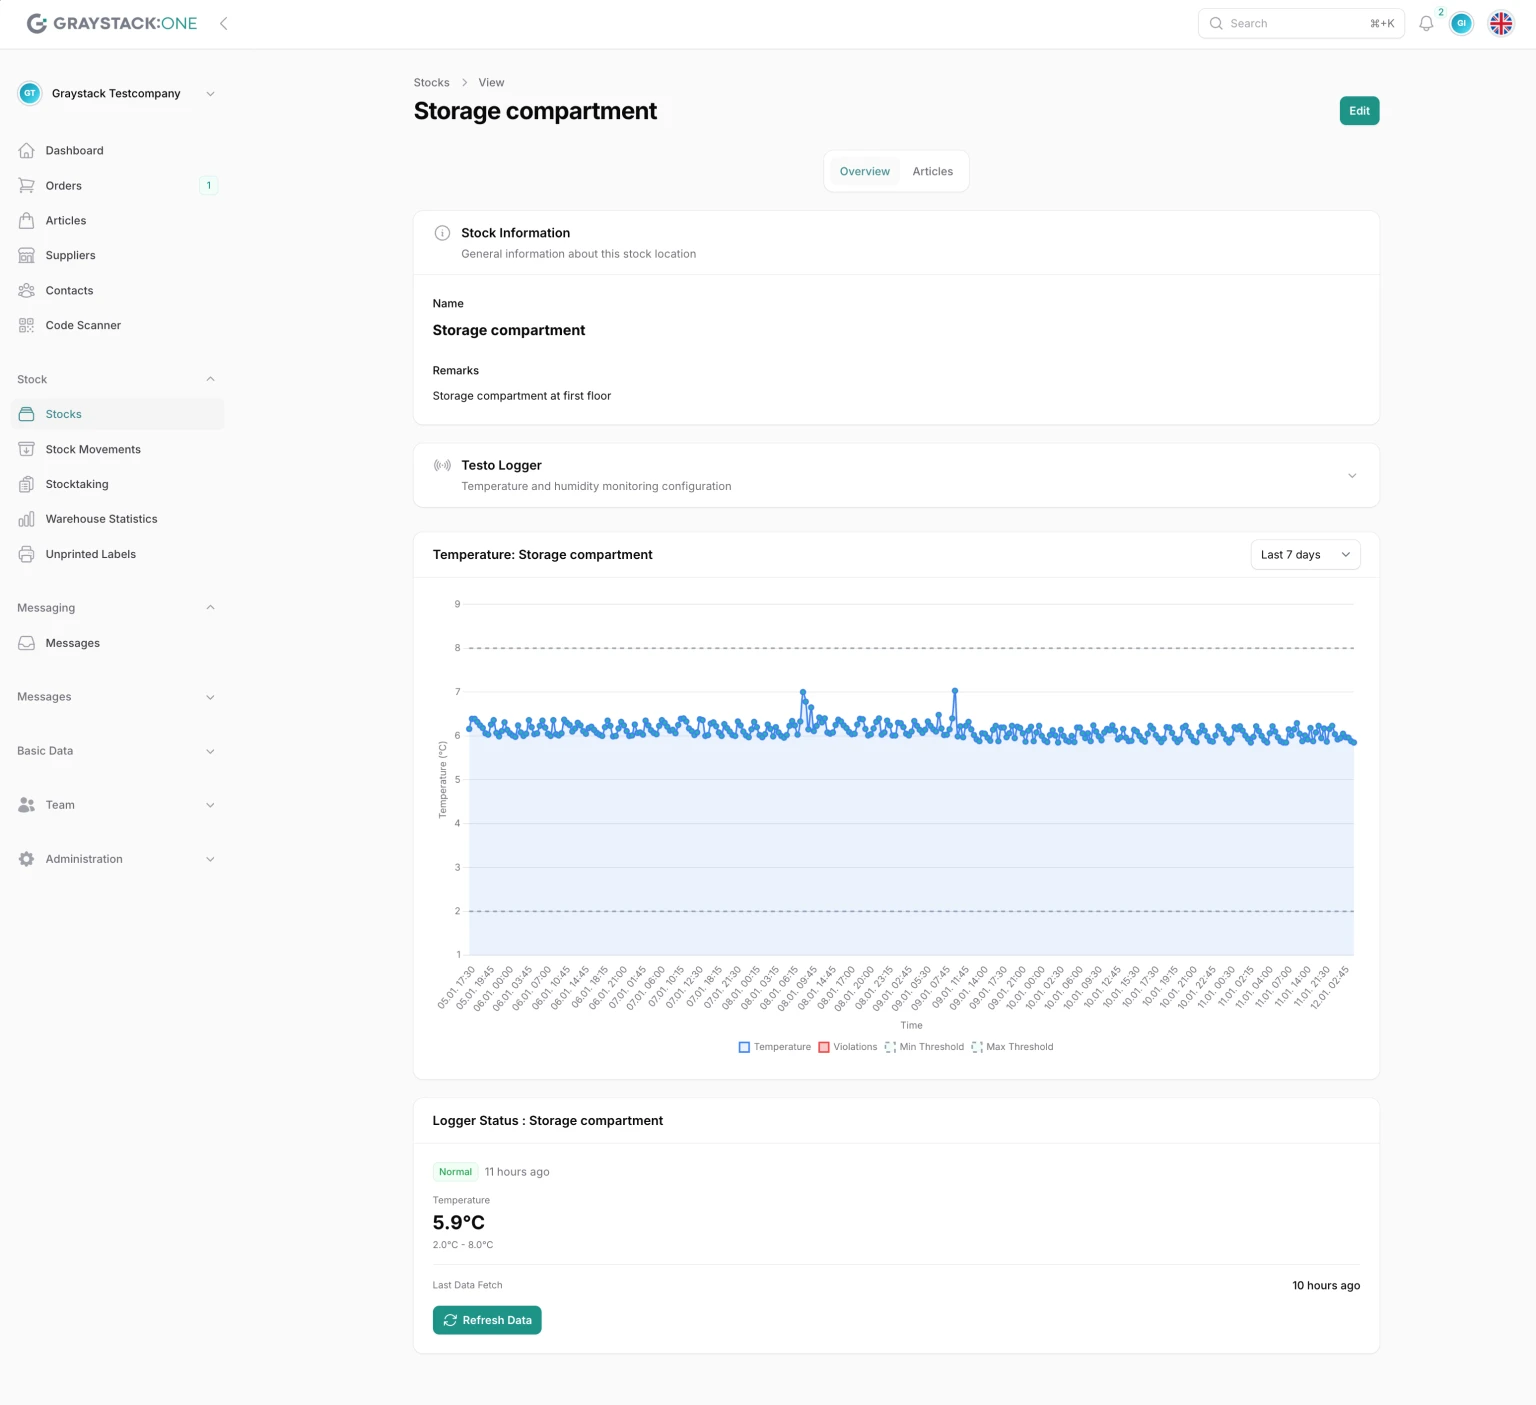
After clicking on the logger icon, a graph will be displayed showing the temperature over a specific period of time. If you have a logger that also evaluates humidity and humidity data is available, a similar graph with the humidity data will be displayed next to it. These graphs help you to identify fluctuations and ensure that the temperature and humidity remain within the specified limits.
Values that are outside the limits are displayed in red.
If you move the mouse over a specific value, you will see details about it, including the min/max value that was set for this storage location on the logger at that time (see Configuring the temperature logger). You can also use the filter at the top right of the chart to specify the time period for the data displayed.
Display logger data for storage time of items
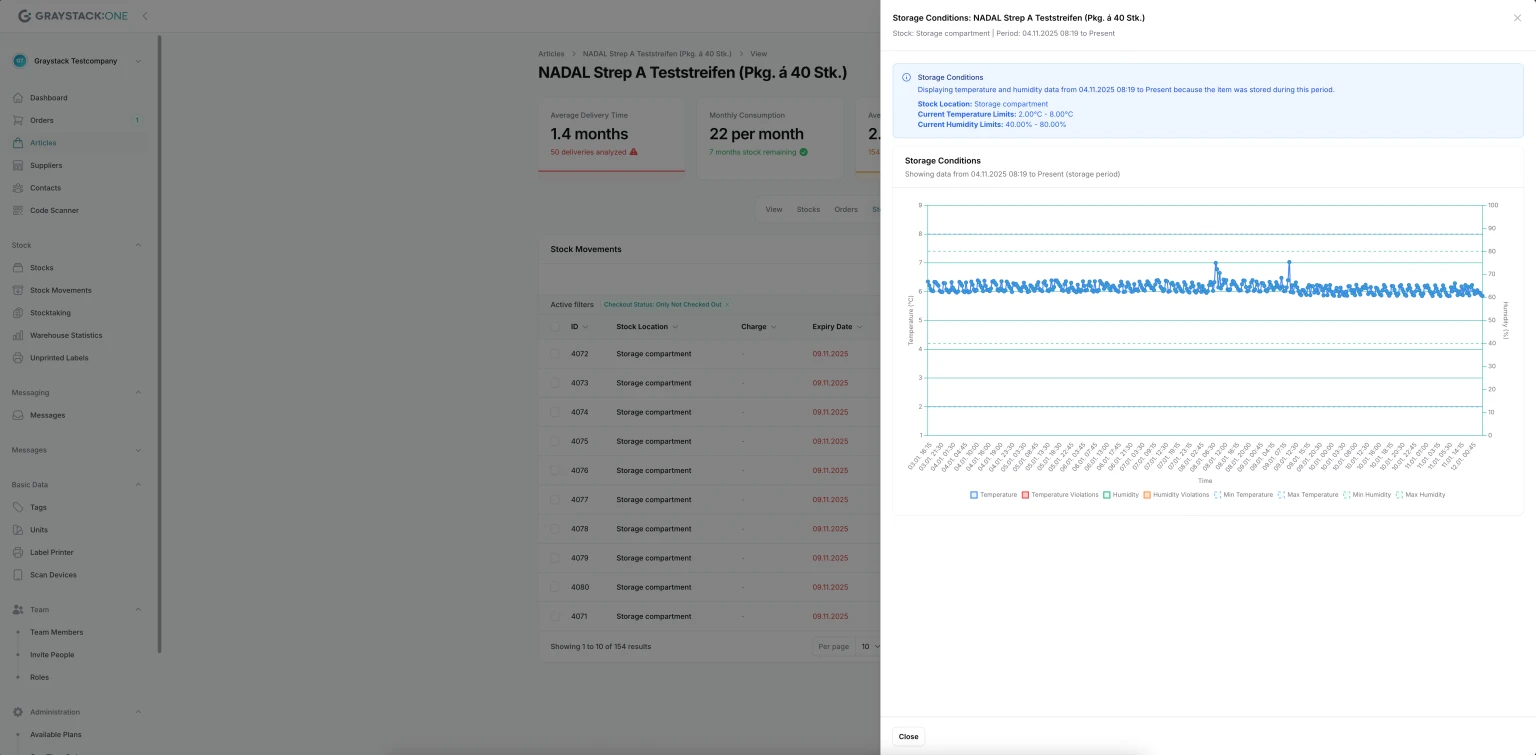
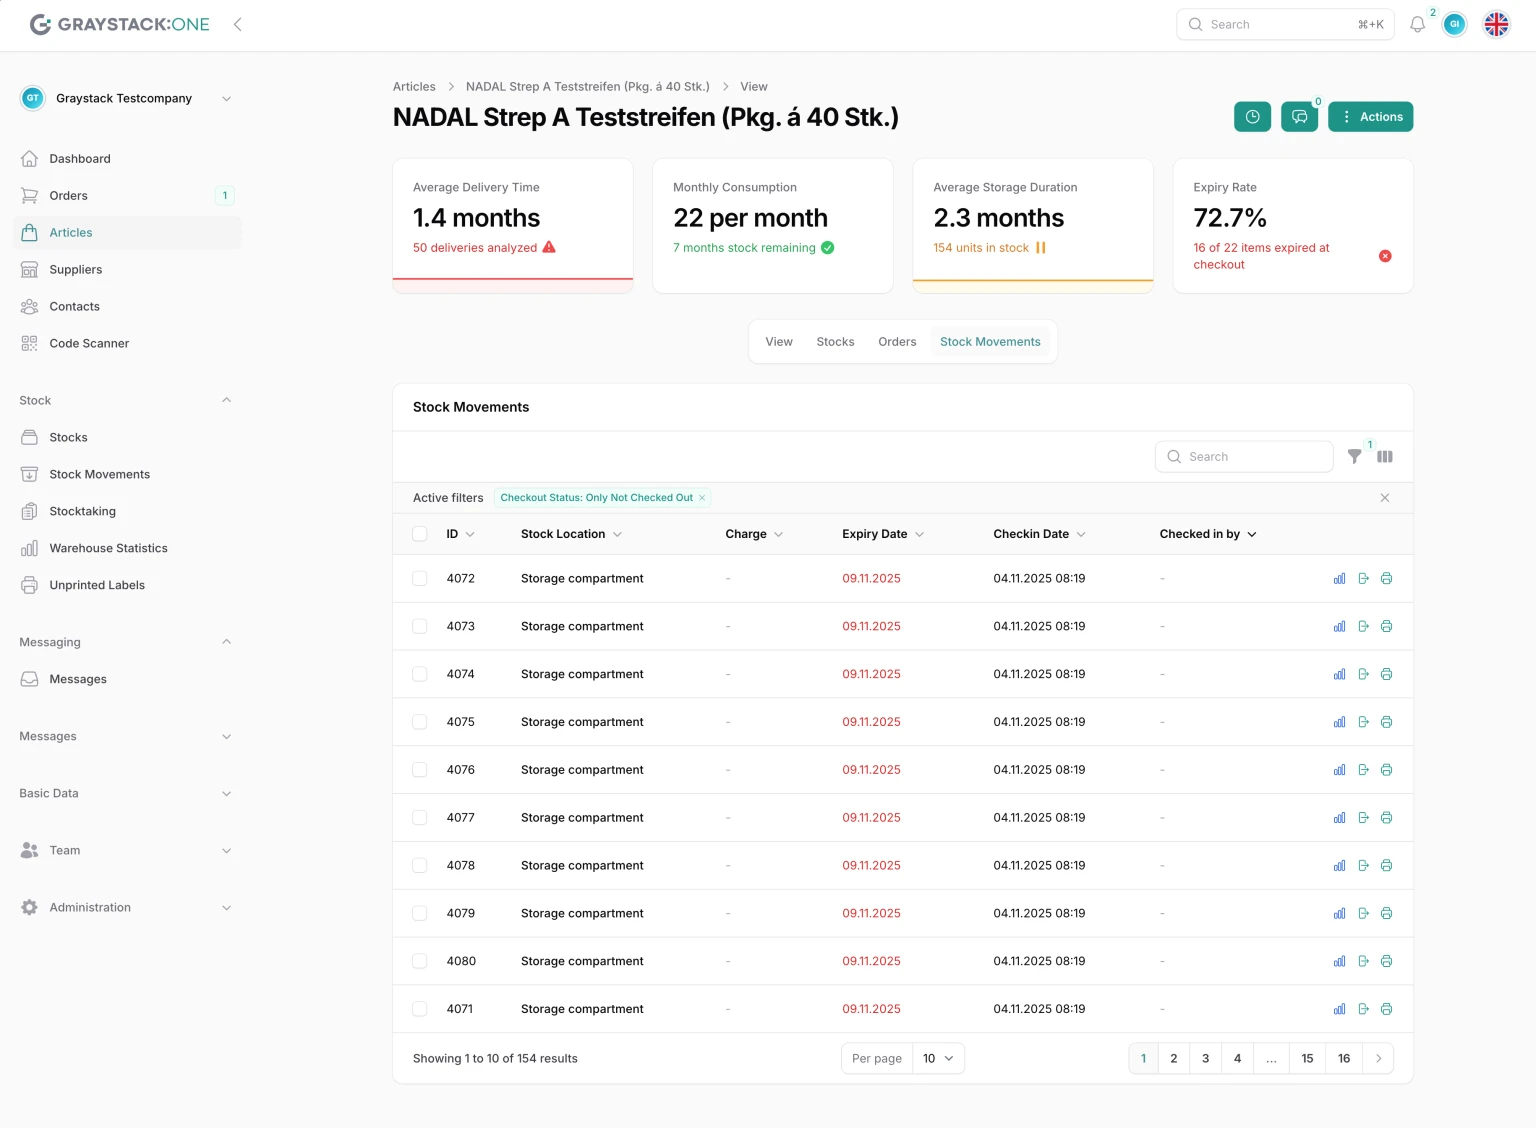
If you go to "Stock Movements" in the detailed view of an item, you will see a blue bar icon in the actions on the right side of the table. If you click on it, you will see the storage data for the selected item (exactly this item) for the time during which this item was stored in the corresponding warehouse.
Important: This display is only possible for the current storage location. If you have relocated the item, you must evaluate the data using the overall display for the corresponding warehouse.
The graphic is to be interpreted in the same way as the display at the storage location itself. The screenshot only shows the temperature display, but humidity data is also displayed here if available.